Rspec boot up takes longer than your webpack? No longer
Intro
TDD is a very enjoyable way to code, as a way of always receiving rapid feedback that what you’re doing is most likely correct while checking for regressions very quickly. The issue then becomes when your Specs take longer to run, or in our case, boot up.
For example, a standard unit test for one of our Models:
Finished in 1.15 seconds (files took 12.04 seconds to load)
1 example, 0 failures
Having a 10+ second feedback loop, even for one simple unit test really made TDD inefficient. This made the TDD process not enjoyable, and it also became very easy to break concentration losing even more time.
My team recently started a major initiative to start writing a lot more tests for everything, so being able to speed the boot process up would really help with getting that started.
The first step is to figure out exactly what is going wrong, before trying to fix it. If you don’t know where or what the performance issues are, you can’t fix them.
How to Profile Start Up Speed
We first need to profile and see what’s happening before we can fix it, this handy snippet lets you plug in directly to the require that’s happens whenever any rails app is booted up including when you run RSpec.
Another option is the Bumbler gem, if the snippet doesn’t work for you.
The first step was to build an empty spec file to purely check RSpec’s loading and run time.
require 'rails_helper'

class Empty
  def self.test
    true
  end
end

describe Empty do
  it { expect(Empty.test).to be_truthy }
end
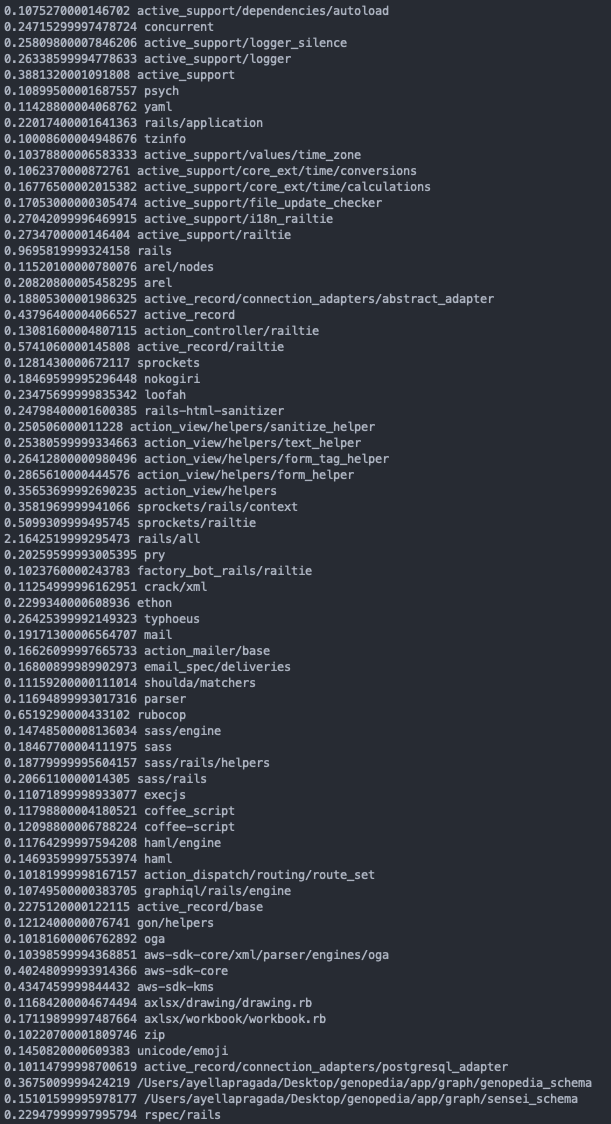
Now if we run RSpec, we see this large block of everything that’s being loaded, and we see how it’s adding up into the 10+ seconds that it takes to run a single spec.

Here’s what our current situation looks like, and this has been measured by taking the average of 5 runs of the empty spec file from above.
bundle exec rspec specs/benchmarks/empty_spec.rb
Finished in 0.634441 seconds (files took 13.00 seconds to load)
There must be a way to either make this better, or cache it.
The first option that popped to mind is going through the Gemfile, adding require: false to the gems that didn’t need to be loaded every time, and then specifically require them in the app. That could’ve worked, but honestly it’s a lot of work, and possibly wouldn’t bring the speed down that much.
The more efficient option felt like using Spring to cache the app’s dependencies and preload it, but if that doesn’t work then it would be possible to start removing the longest loading ones.
Adding Spring
This part is pretty straightforward. I based a lot of what I did off of this other blog post and the spring documentation.
Step 1 is to add these two gems to the gemfile:
group :test, :development do
  # ...
  gem "spring"
  gem 'spring-commands-rspec'
end
Then run bundle install and bundle exec spring binstub rspec to create bin/rspec.
Now, let’s try this again and observe the load time, this time using the spring command:
spring rspec spec/benchmarks/empty_spec.rb
Finished in 1 second (files took 0.70336 seconds to load)
Great, it’s loading so quickly! Wow! Except this would be a pretty boring blog post if the take away was “Just Use Spring”. Look at the run time for this same spec, it’s now taking almost an extra 40% of time!
This is where it gets really interesting. We need to profile our specs themselves and see where the issues lie.
How To Profile Running Specs
We’ll need a few tools to help with this, stackprof and stackprof-webnav.
Stackprof is a sampling call-stack profiler built for Ruby. What that means is we’ll execute the code, take samples of the call stack as it is at each point, and then will let you know what is actually happening in your code.
Stackprof-webnav is just a helper to view the stack trace dumps in a browser. Stackprof itself already has built in ways, but this just makes it easier.
Here’s a simple snippet I used to get the stack traces dumped, which I added into my spec_helper.rb.
The commented out paths were just for me to have an easy way to split up the folders for different stack traces, or for a before and after.
You may also need to make these folders in the rails_app_root/tmp/ directory if you get any errors.
RSpec.configure do |config|
  # ... other config code ...

  config.around(:each) do |example|
    # path = Rails.root.join("tmp/no_spring/#{example.full_description.parameterize}.dump")
    path = Rails.root.join("tmp/with_spring/#{example.full_description.parameterize}.dump")
    StackProf.run(mode: :cpu, out: path.to_s, raw: true) do
      example.run
    end
  end
These files will get generated whenever you run RSpec, so you’ll want to try out the 2 separate variations and make sure the right path name is commented out. Either you’ll use bundle exec rspec /path/to/file_spec.rb or spring rspec /path/to/file_spec.rb.
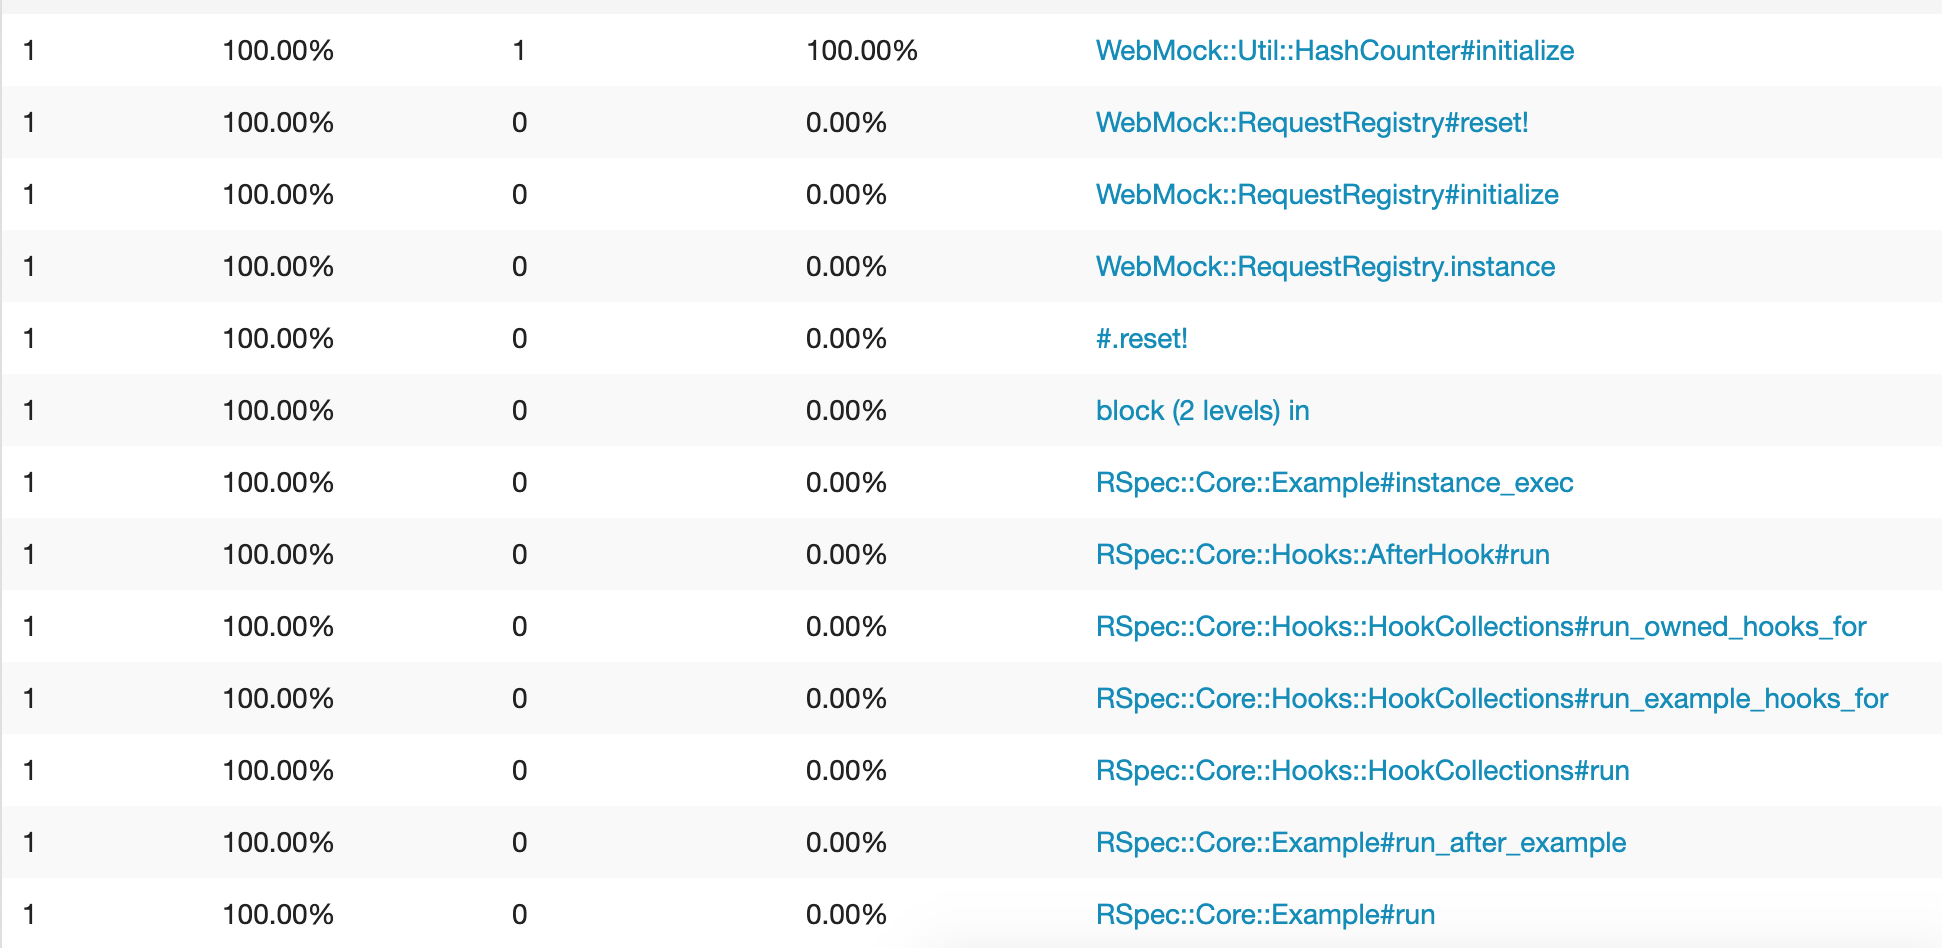
Let’s look at the no_spring version first, just so we have a general idea of the benchline for all of this.

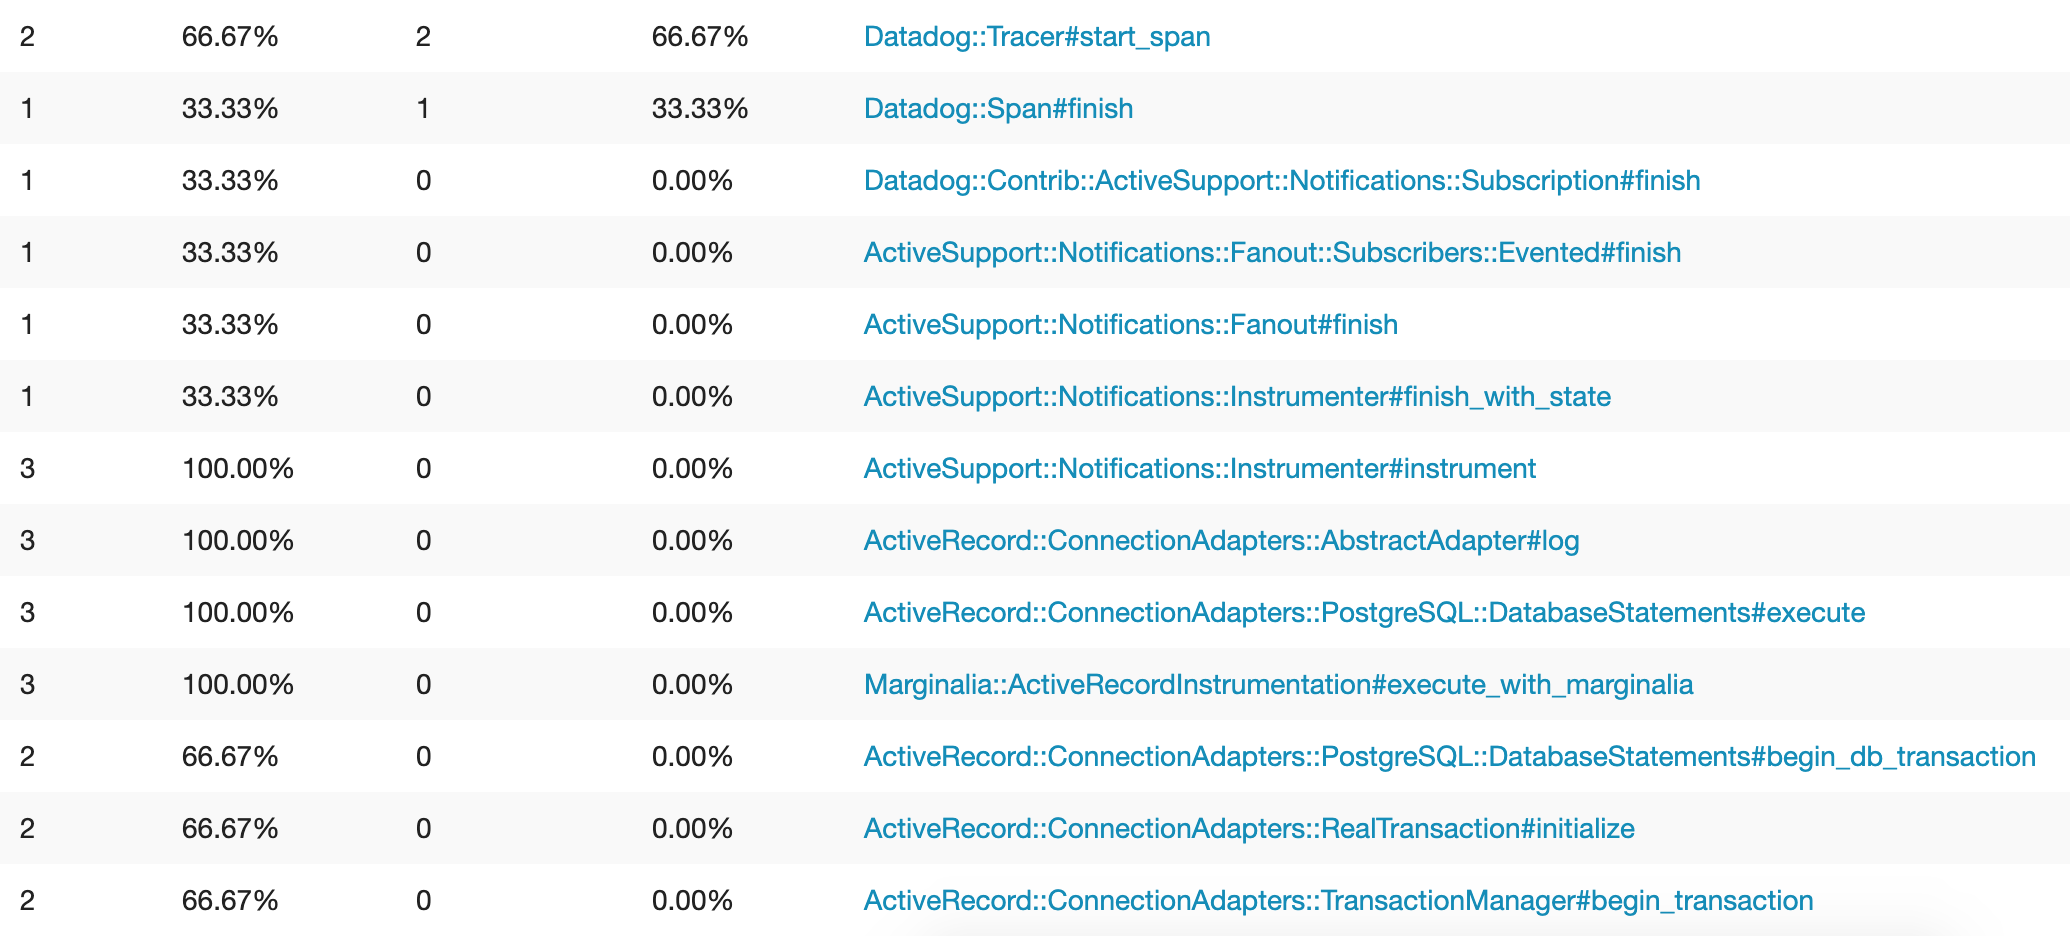
This all seems fine now. Let’s check the with_spring version next and see if there’s anything odd to be noticed.

Yep, right there at the very top, there’s the issue. Spring packaged everything in, including Datadog. This is something that would’ve been hard to catch without profiling, since there were no errors or other warnings pointing us that this code was now being run now.
There’s a pretty straightforward fix for this issue:
- Move Datadog gem (
ddtrace) into the Production-Only group of our Gemfile. - Check our code for everywhere we use Datadog.
- Place all code that touches Datadog into a block that only runs it if we’re on Production, or have access to Datadog.
In this app, we only had 2 locations, one in the initializer and one in a domain logic specific area for measurement purposes.
Now let’s go ahead and regenerate the spring rspec stub, and try this again.
The before, just for context:
$ bundle exec rspec specs/benchmarks/empty_spec.rb
Load: 13.00 seconds, Run: 0.634441 seconds.
And the after:
$ spring rspec spec/benchmarks/empty_spec.rb
Load: 0.63126 seconds, Run: 0.53728 seconds.
There we go, that’s perfect. Similar run times, drastically faster load times.
